188-189
We define the population size at a given time (t) as N(t), where N represents the number of individuals. Let us assume that the initial population is small, N(0) = 100 (where 0 refers to time zero at the start of the experiment), so that the food supply within the aquarium is much more than is needed to support the current population. How will the population change over time?
In our hypothetical experiment, let us assume that the initial population produced 40 new individuals (births) over the first day (B = 40) and that 10 of the original 100 hydra died (D = 10). The population size at the end of day 1, N(1), can then be calculated from the initial population size, N(0), and the observed numbers of births (B) and deaths (D):N(0) + B - D = N(1)
or
100 + 40 - 10 = 130But what if we now want to predict what the population will be the following day, N(2)? How could we use the measures of B and D to determine the number of births and deaths that will occur in our population that is now composed of 130 hydra? Although B and D represent the measure of birth and death in the population, the actual values are dependent on the initial population size, N(0) = 100. For example, if the initial population size was 200 rather than 100, we could assume that the values of B and D would be twice as large. If we wish to calculate an estimate of birthrate that is independent of the initial population size we need to divide the number of hydra born during the day by the initial population size: B/N(0) or 40/100. We can now define the resulting value 0.4 as b, which is the per capita birthrate. The per capita birthrate is the average number of births per individual during the time period t (one day). Likewise, we can calculate the per capita death rate as D/N(0) of 10/100 = 0.1. The advantage of expressing the observed values of birth (B) and death (D) for the population as per capita rates (b and d) is that if we assume they are constant (do not change over time), we can use b and d to predict the growth of the population over time regardless of the population size N(t).
189
is the change in the population size N over the time interval (t + 1) − t. If we represent the change in population size as ΔN and the change in time (the time interval) as Δt—the mathematical symbol Δ refers to a “change” in the associated variable—we can rewrite the equation for the rate of population change in a simplified form:
∆N/∆t = (b - d)N(t)
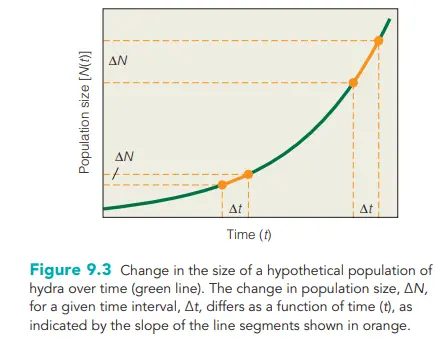
. Note that because the pattern of population growth is an upward sloping curve, the rate of population change depends on the time interval being viewed (see Figure 9.3 and preceding calculations). With a population that is growing geometrically, the rate of population growth is continuously increasing as the population size increases
189
Because birthrates and death rates, b and d, are constants (fixed values), we can simplify the equation even further by defining a new parameter r = (b – d). The value r is the per capita growth rate.
∆N / ∆t = rN(t)
Thus, the population growth rate (ΔN/Δt) defines the unit change in population size per unit change in time, or the slope of the relationship between N(t) and t (the “rise” over the “run”) presented in Figure 9.3